Vive la magia de Cuzco y Machu Picchu
Haz clic para reproducir el video
¡Descubre Machu Picchu como nunca antes! Vive la magia de una de las maravillas del mundo con expertos locales.

Viaja con expertos
Inclusive InkaQuest Tours es una empresa de viajes de aventura con licencia profesional con sede en la histórica ciudad andina de Cusco, Machupicchu para viajar a Perú. Operamos caminatas a Machu Picchu, viajes y viajes de aventura en todo Perú, utilizando nuestro propio personal profesional.
Nuestros paquetes turísticos están diseñados para cada tipo de viajero. Ofrecemos opciones que se adaptan a todos los bolsillos: desde paquetes económicos hasta experiencias completamente personalizadas.
Descubre cusco
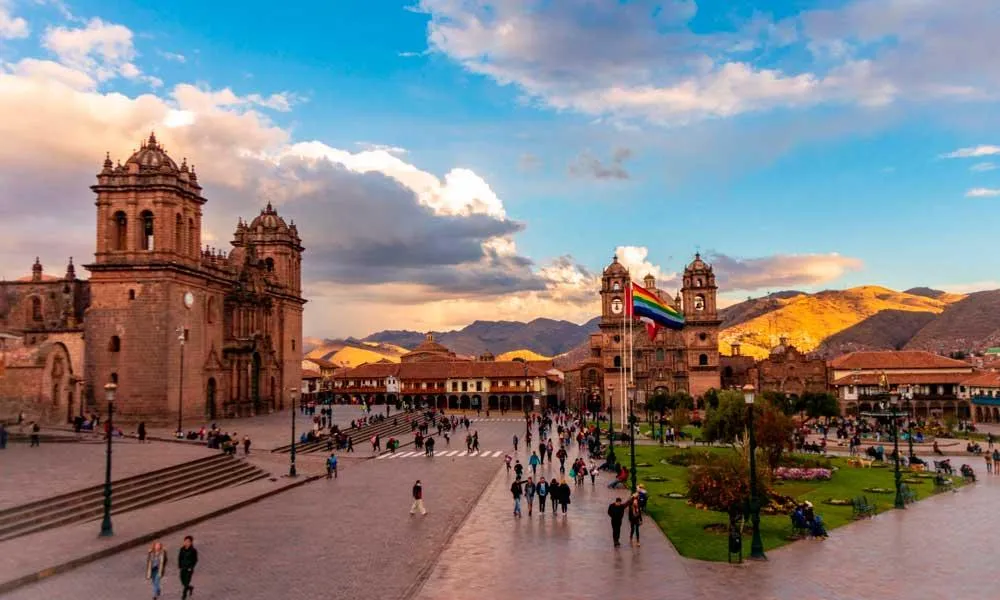
City Tour en la Ciudad de Cusco
Comenzaremos nuestra aventura en la majestuosa Plaza de Armas, visitaremos La Catedral, el Qoricancha o Templo del Sol.
Luego continuaremos visitando los sitios arqueológicos que se encuentran aledaños a la ciudad de Cusco los cuales son: Sacsayhuamán, Q’enqo, Puka pukara y Tambomachay.
Al finalizar el tour retornaremos a Cusco.
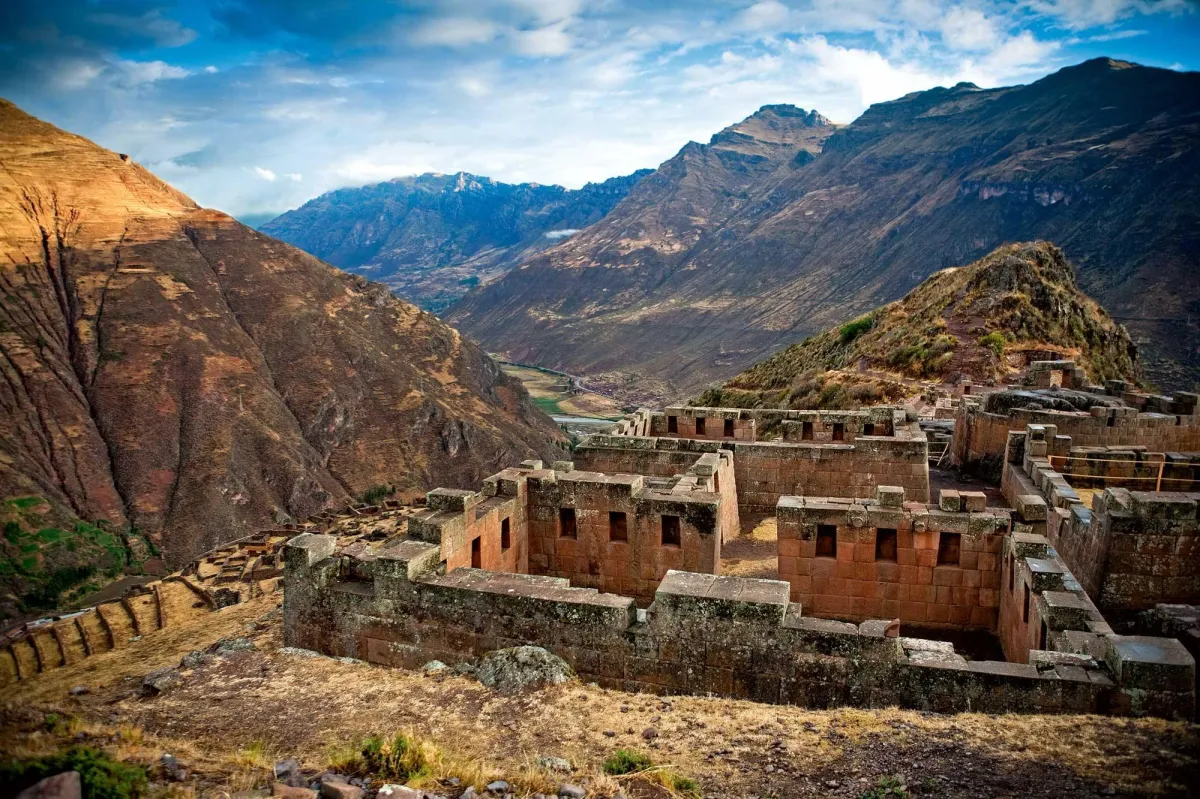
EL VALLE SAGRADO DE LOS INCAS
Iniciando nuestra aventura llegaremos a nuestro primer punto el mirador de Taray donde observamos El Valle Sagrado; para luego ir rumbo al complejo arqueológico de Pisaq.
Pasaremos por el margen del río Vilcanota hasta llegar a Urubamba, Aquí nos detendremos para un exquisito almuerzo buffet de platos variados. Continuando conoceremos Ollantaytambo, uno de los últimos pueblos Inca vivientes tendremos y tiempo para recorrer el maravilloso complejo arqueológico.
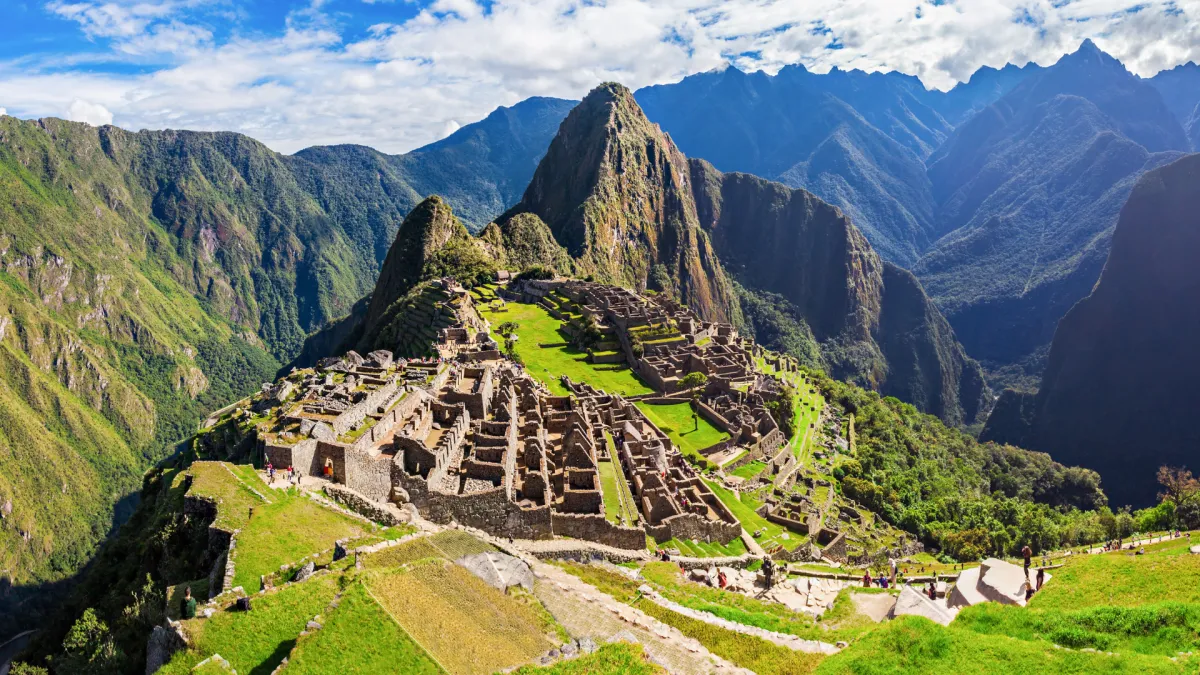
EXPLORANDO MACHUPICCHU
Iniciaremos la aventura con un desayuno antes de tomar el bus turístico desde Aguas Calientes hacia Machu Picchu, disfrutando del paisaje verde del Santuario.
Una vez allí, recorreremos este mágico lugar durante 2 horas con un guía experto, visitando el Templo de las Tres Ventanas, el Reloj Solar y más.
Tendremos tiempo para fotos antes de regresar a Aguas Calientes, donde podrás disfrutar de un almuerzo (por cuenta propia). Por la tarde, tomaremos el tren hacia Ollantaytambo y luego un bus de regreso a Cusco, cerrando un día inolvidable.
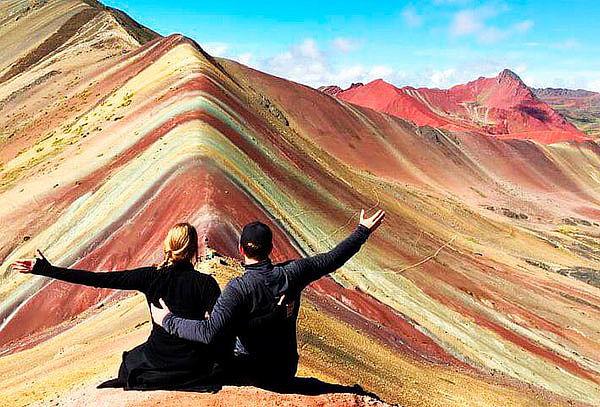
MONTAÑA DE COLORES
Partimos a las 4:30 am hacia Cusipata, donde desayunaremos.
Desde Phulawasipata iniciaremos una caminata de 1h 45min hasta la Montaña de 7 Colores.
Allí disfrutaremos de vistas espectaculares, tiempo libre y explicación del guía. Después, regresaremos para almorzar y retornar a Cusco. ¡Una experiencia inolvidable!
Con nosotros, no solo visitas Machu Picchu, ¡lo vives! Aprovecha la oportunidad de disfrutar de guías expertos, itinerarios ajustados a tus intereses y la satisfacción de apoyar a operadores locales comprometidos con el turismo responsable.
Clientes felices

Andrea Lopéz
"Una experiencia inolvidable"

Gracias a esta agencia pude cumplir mi sueño de conocer Machu Picchu. Todo estuvo perfectamente organizado, desde los traslados hasta las explicaciones del guía. ¡Recomiendo 100% viajar con ellos

Francisco Arriagada
"Excelente atención y profesionalismo"
Hicimos el tour a la Montaña de 7 Colores y fue increíble. Los guías son muy atentos y los tiempos están bien calculados. Nos sentimos seguros y disfrutamos cada momento

Yaritza García
"Un viaje para recordar toda la vida"
El recorrido por Cusco y Machu Picchu superó mis expectativas. El servicio fue impecable y los paisajes, impresionantes. Definitivamente volvería a viajar con esta agencia.
No esperes más. ¡Reserva tu aventura hoy mismo! Haz clic aquí para obtener más información o para contactar a nuestro equipo por whatsapp
Todos los derechos reservados - Inkaquest.com